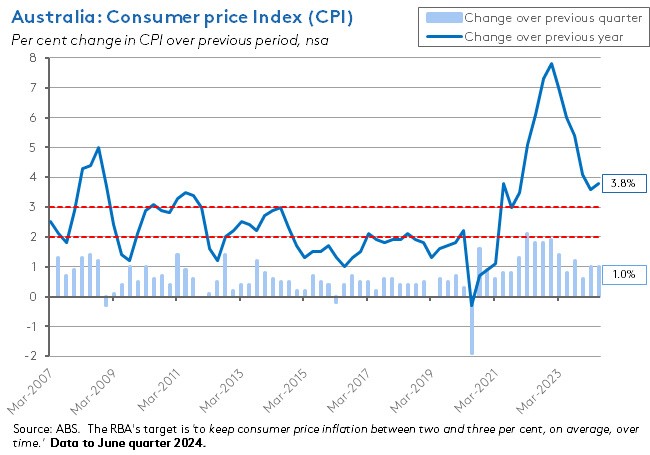
It’s been clear for some time that this week’s June quarter Consumer Price Index (CPI) result could have a significant influence on next week’s RBA Board Meeting. The stakes had been raised by a sequence of disappointingly high readings from the April and May 2024 Monthly CPI Indicators, which had together suggested some upside risk to the Q2:2024 reading. In the event, that risk mostly failed to materialise.
The annual rate of headline CPI inflation printed at 3.8 per cent and while that did represent a setback in the disinflationary process relative to the March quarter’s 3.6 per cent result, it was nevertheless in line with the RBA’s latest set of projections as well as with the market consensus forecast. Similarly, the annual rate of underlying inflation came in at 3.9 per cent in the June quarter. That was down on the March quarter result and slightly softer than market expectations, although a little above the RBA’s forecast of 3.8 per cent.
All up, this week’s numbers were broadly consistent with Martin Place’s description of a disinflation process that will ‘take time’ and ‘be bumpy’ but that will see inflation return to target.
Previous weekly notes had warned that an upside surprise involving headline or underlying inflation results with a ‘four’ in front of them would have put the RBA under pressure to hike the cash rate on 6 August. But with both inflation measures printing with a ‘three’ in front of them, it follows that the RBA will be able to remain on hold next week. That also means that my revised June 2024 forecast of a first change in the cash rate coming in the form of a rate cut in February 2025 continues to hold. In the aftermath of Wednesday’s CPI data release, market pricing – which had been much more conservative on the likely timing of a rate cut – has also moved to almost fully price in a February 2025 move.
More detail on the June quarterly and monthly inflation numbers below, along with updates on retail sales, house prices and other data releases from this week.
Finally, please note that the weekly economics update (and the Dismal Science podcast) will now be taking a break until the final week of August. We should be back in your inboxes with an edition on 30 August, all being well.
The June quarter inflation reading was in line with market expectations
The ABS said that Australia’s Consumer Price Index (CPI) rose one per cent over the June quarter 2024 to be 3.8 per cent higher than in the corresponding quarter last year. The quarterly rate of growth was unchanged from the previous quarter although the annual rate was up from the March quarter’s 3.6 per cent, representing the first increase in the headline rate since the December quarter 2022. The result was in line with both the market consensus forecast and with the forecast presented in the RBA’s May 2024 Statement on Monetary Policy.
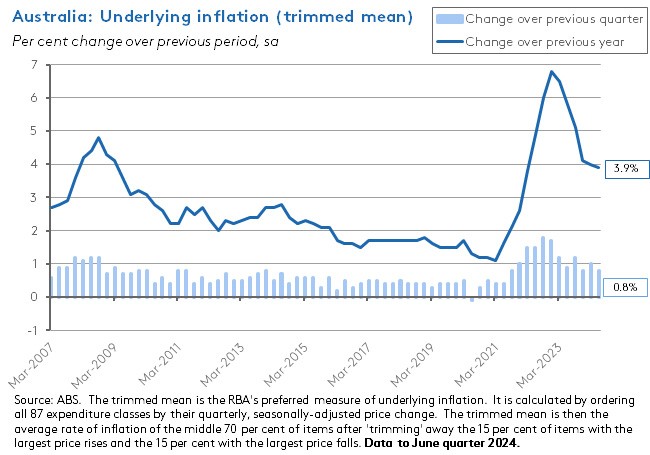
The Trimmed mean – the RBA’s preferred measure of underlying inflation – rose 0.8 per cent over the quarter and 3.9 per cent over the year. That was the sixth consecutive quarterly decline in the annual rate of underlying inflation. The Trimmed mean reading came in below market expectations (the consensus call had been for a one per cent quarterly increase and a four per cent annual reading) but slightly above the RBA forecast, which had anticipated a 3.8 per cent print in line with the headline CPI.
According to the ABS, the most significant contributors to the one per cent quarterly rise in the headline CPI were the Housing (up 1.1 per cent) and Food and non-alcoholic beverages (up 1.2 per cent) groups. The rise in the former was driven by increases in rents (up two per cent over the quarter) and New dwellings purchased by owner-occupiers (up 1.1 per cent) while the latter reflected quarterly rises for Fruit and vegetables (a 6.3 per cent jump in the highest quarterly rise for this component since 2016 due to unfavourable growing conditions), Meals and take away food (up 0.6 per cent) and Meat and seafood (up 1.3 per cent).
The main contributors to the 3.8 per cent annual increase again included the Housing (up 5.2 per cent) and Food and non-alcoholic beverages (up 3.3 per cent) groups, along with the Transport group (up 4.6 per cent). Annual price increases for housing were driven by rents (up 7.3 per cent – but absent the impact of increased Commonwealth Rent Assistance from March this year they would have been up by 9.1 per cent), New dwellings (up 5.1 per cent), and Electricity prices (up six per cent – but in the absence of the impact of Energy Bill Relief Fund rebates they would have soared by 14.6 per cent). Food inflation again reflected the impact of unfavourable growing conditions on fruit prices. Transport costs were pushed up by higher automotive fuel prices (up 7.7 per cent over the year). There was also an impact from higher insurance prices, which were up 14 per cent over the year. That partly reflects higher reinsurance, natural disaster and claims costs for motor vehicle, house, and home contents insurance. In addition, there was also an increase in private health insurance premiums, which the ABS notes are typically reviewed every April.
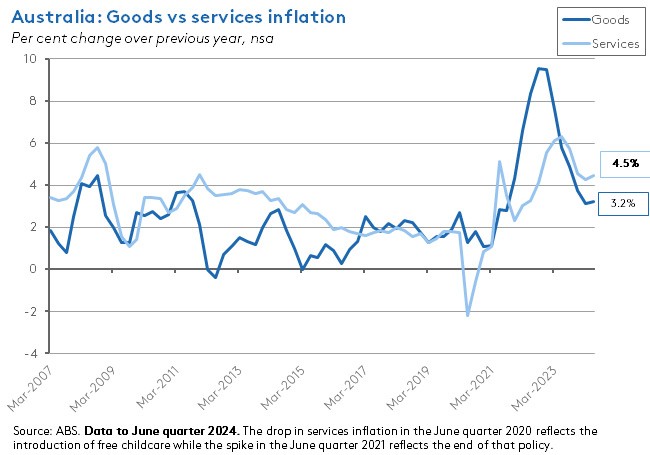
Turning to the analytical categories of the CPI shows that the annual rate of services inflation continues to outpace goods inflation, even as both measures edged up in the June quarter, with the rate of increase in goods prices increasing for the first time since the September quarter 2022.
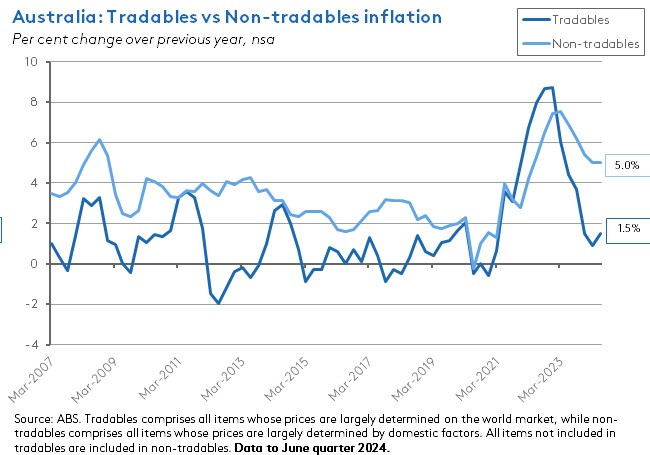
It was a similar story with the tradables vs non-tradables split, where non-tradables inflation continues to run ahead of tradables inflation. At the same time, the annual rate of tradable inflation increased for the first time since the September quarter 2022, rising from 0.9 per cent in the March quarter of this year to 1.5 per cent in the June quarter while the annual rate of non-tradables inflation was unchanged from the March quarter at five per cent.
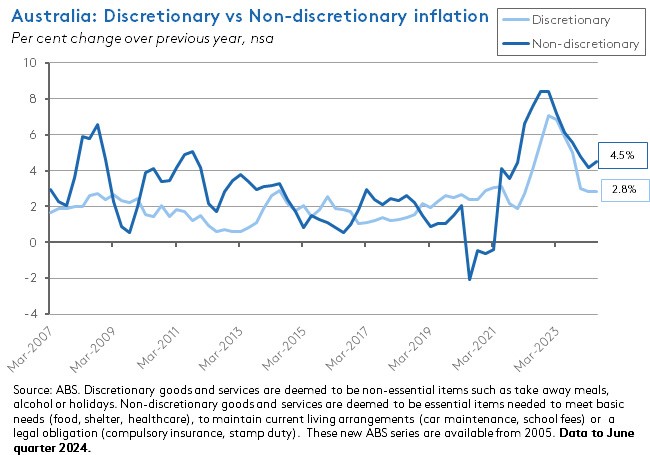
Next, at an annual rate of 4.5 per cent (up from 4.2 per cent in the March quarter), non-discretionary inflation remains significantly stronger than discretionary inflation at 2.8 per cent (down slightly from 2.9 per cent in the previous quarter).
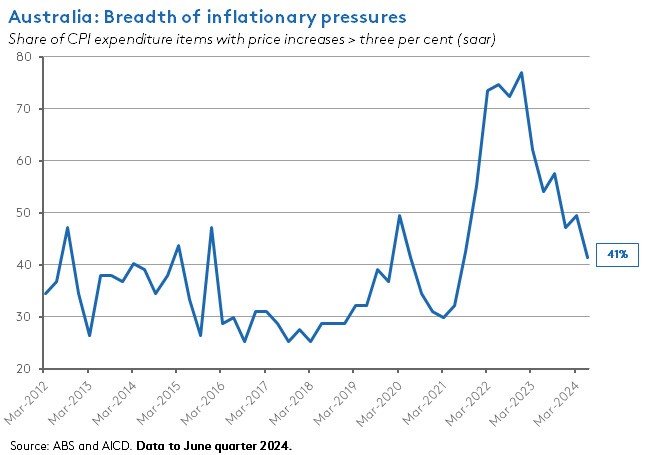
Finally, the share of expenditure classes within the CPI basket where prices are rising at a (seasonally adjusted) annualised rate of more than three per cent has now fallen from close to 50 per cent in the March quarter CPI to nearer 40 per cent in the June quarter CPI.
The monthly CPI indicator rose 3.8 per cent over the year to June 2024
Along with the second quarter CPI results, the ABS also published the monthly CPI indicator for June 2024. This showed the annual rate of inflation for the monthly CPI Indicator slowing from four per cent in May to 3.8 per cent in June. The monthly result was also in line with the median market forecast.
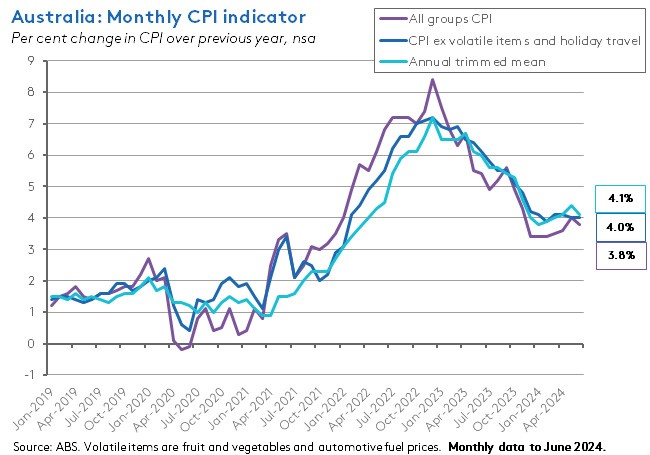
The annual rate of change in the monthly CPI Indicator excluding volatile items and holiday travel was four per cent in June, unchanged from the May reading, while the rate of increase in the Annual Trimmed mean fell to 4.1 per cent in June from 4.4 per cent in May. Despite rising seven per cent over the month, holiday travel and accommodation prices fell 0.7 per cent over the year to June 2024 as the impact of the large monthly rise of 10.9 per cent recorded in June 2023 dropped out of the annual comparisons.
The most significant contributors to the 3.8 per cent annual rise in the monthly CPI Indicator were the Housing (up 5.5 per cent over the year), Food and non-alcoholic beverages (up 3.3 per cent), Alcohol and tobacco (up 6.9 per cent) and Transport (up 4.2 per cent) groups. The increase in the Housing group reflected ongoing strength in New dwellings prices (up 5.4 per cent over the year), rental prices (up 7.1 per cent) and electricity prices (up 7.5 per cent) while the rise in the Transport group was driven by a 4.2 per cent increase in automotive fuel prices.
Nominal retail sales grew in June 2024 but fell in volume terms over the second quarter
The ABS said that retail sales rose 0.5 per cent over the month (seasonally adjusted) in June 2024 to be up 2.9 per cent over the year. That was stronger than the consensus forecast for a 0.2 per cent monthly increase. According to the Bureau, the monthly numbers were boosted by a larger-than-usual impact from End-of-financial year sales, particularly for discretionary items including furniture, electrical goods, and clothing. Turnover was up over the month across all industries in June except for cafes, restaurants, and takeaway services where it was flat, with the largest gains in sales occurring in Household goods retailing (up 1.1 per cent month-on-month) and Department Stores and Other retailing (both up one per cent).
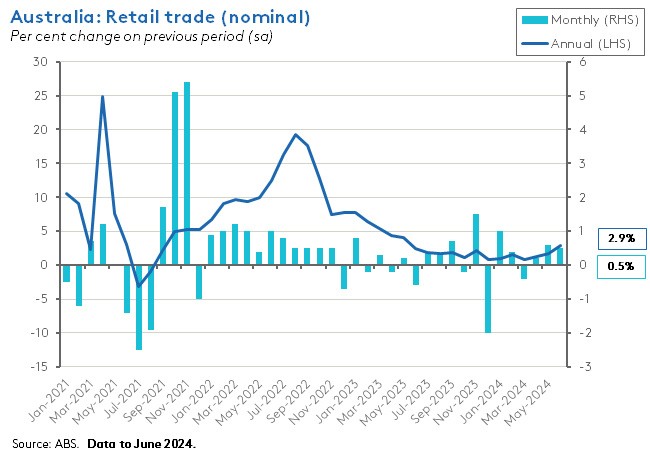
For the June quarter 2024, retail volumes were down 0.3 per cent over the quarter – the sixth fall in the past seven quarters – and 0.6 per cent lower over the year. That was a slightly steeper fall than the market consensus forecast, which had expected a 0.2 per cent quarterly decline.
On a per capita basis, retail volumes fell for an eighth consecutive quarter, dropping 0.9 per cent in quarterly times and falling three per cent on an annual basis. They are now at their lowest level since the September quarter 2021 (although still 2.3 per cent above their pre-pandemic December quarter 2019 level).
The discrepancy between the quarterly decline in volume terms and the rise in monthly turnover in value terms is indicative of the way that much of the growth in the latter reflects higher prices.
What else happened on the Australian data front this week?
CoreLogic reported that national home values rose 0.5 per cent in July this year, recording their 18th consecutive monthly increase. The national index was up 7.6 per cent compared to July 2023. The combined capitals index also increased by 0.5 per cent over the month to stand 7.9 per cent higher in annual terms. Despite the ongoing rise in home values, however, CoreLogic also said that there was evidence of declining momentum in the housing cycle, with three capital cities (Melbourne, Hobart, and Darwin) reporting a decline in values over the past three months and a fourth (Sydney) showing much softer growth. The data provider cited an erosion in borrowing capacity and affordability factors, along with differences in available supply, as driving price dynamics. Meanwhile, CoreLogic’s rental index was only 0.1 per cent higher in July in the weakest result since August 2020, with rents falling over the month in Sydney, Brisbane, and Hobart. This slowing in rental growth is correlated with the peak in net overseas migration in the first quarter of last year.
The ABS said that Australia’s trade balance on goods was $5.6 billion (seasonally adjusted) in June this year, up by $0.5 billion from May’s result. Goods exports were up $0.7 billion, driven by an increase in other mineral fuels, while goods imports rose by $0.2 billion, driven by purchases of capital goods.
The Bureau also reported that Australia’s export price index fell 5.9 per cent over the June quarter 2024 to be down 5.7 per cent in annual terms. According to the ABS, the main drivers of the price fall were declines in Chinese demand for iron ore for steel manufacturing, a decline in global demand for metallurgical coal, and lower gas prices. In contrast, the import price index was up one per cent quarter-on-quarter and 1.1 per cent higher year-on-year.
The ANZ-Roy Morgan Consumer Confidence Index fell 1.3 points to an index reading of 83.1 in the week ending 28 July. That modest fall only partly unwinds some of the previous week’s big 5.9-point jump in confidence, which ANZ had ascribed to the impact of Budget 2024’s tax cuts and cost of living measures. The measure of ‘weekly inflation expectations’ was unchanged from the previous week at five per cent.
According to the ABS, the total number of dwellings approved in June 2024 was 13,237 (seasonally adjusted). That was down 6.5 per cent from May this year and 3.7 per cent below the number of approvals in June 2023. Approvals for private sector houses were 9,078: down 0.5 per cent month-on-month but up 11 per cent year-on-year. Approvals for private sector dwellings excluding houses numbered 3,918: down 19.7 per cent in monthly terms and down 22.1 per cent in annual terms. The Bureau said that over the past 12 months there had been a total of 162,892 dwellings approved, compared to 177,936 approvals in the previous 12 months. Approvals in the 2023-24 financial year overall are the lowest since 2011-12 and are running well below the kind of rates that would be consistent with the government's pledge to build 1.2 million new homes by 2029, which would imply an average annual construction rate of around 240,000.
Other things to note . . .
- A summary of the latest Deloitte Access Economics Business Outlook.
- Some background on allegations that ANZ manipulated government bond sales.
- In the AFR, the Productivity Commission (PC) defends its record and rejects the need for an ‘ESG makeover’. The PC Chair and Deputy chair were responding to this piece.
- How viable are small and/or budget airlines in Australia?
- Greg Earl on Canberra’s evolving approach to geopolitics and economic statecraft.
- Related, a Shiro Armstrong lecture on the role of economic statecraft in securing Australia’s future.
- The WSJ’s Andrew Glynn compares and contrasts the monetary policy approaches of the RBA (425bp of tightening to date, starting in May 2022) and the RBNZ (525bp starting in October 2021).
- The FT’s Chris Giles says central bank inflation forecasts have become much more accurate following their initial big misses post-pandemic.
- With many observers claiming that geopolitical risks to energy security are a top risk this year (OPEC quota decisions, Ukrainian attacks on Russian oil infrastructure, the G7 sanctions mechanism, disruptions to shipping in the Red Sea) this column looks at the role of geopolitical risks to oil production as a driver of macroeconomic fluctuations.
- The Economist magazine considers China’s new economic vision. The Peterson Institute reckons that Beijing’s approach risks more tensions with the world.
- The IMF’s latest assessment of Euro Area policies.
- Could AI trigger financial crises?
- On the US fiscal mess.
- The implications of slower world growth for commodity prices.
- Gallup’s 2024 Global Emotions Report reckons that the world was ‘in a better place emotionally’ in 2023 with its measure of negative emotions dropping for the first time in a decade.
- Some reading recommendations from the Economist magazine.
- Henry Farrell on the late James Scott, technology and High Modernism.
- The Grattan podcast discusses the RBA and interest rates.
- The FT’s Unhedged podcast tackles ways to devalue the US dollar (something we also discussed on last week’s Dismal Science episode).
- The These Times podcast considers recent developments in the Middle East.
Latest news
Already a member?
Login to view this content


