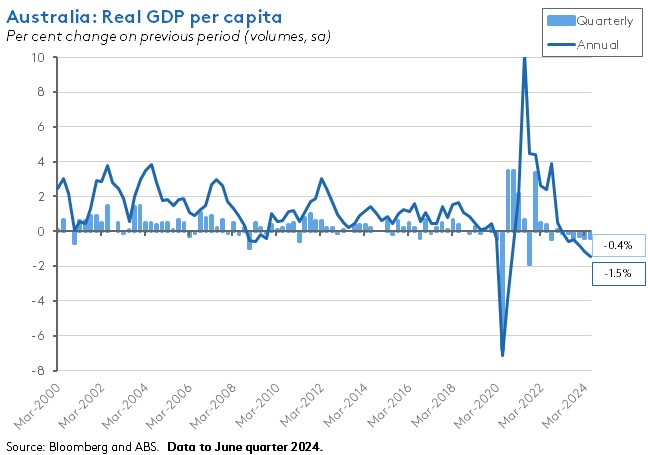
Australia’s economy remains mired in a ‘per capita’ recession. According to the June quarter 2024 national accounts, real GDP per capita shrank by 0.4 per cent over the quarter, marking a sixth consecutive fall. The current per capita recession is now the longest on record. Comparable periods of extended weakness occurred in the early 1980s (between Q4:1981 and Q2:1983 real GDP per capita went backwards for six out of seven quarters) and in the early 1990s (between Q4:1989 and Q4:1991 real output per head fell for six out of nine quarters). However, this is the first period to deliver six quarters of contraction without a break.
Granted, add population growth back into the numbers and overall real GDP growth remained in positive territory, with the June quarter’s 0.2 per cent quarterly rise delivering an 11th consecutive increase in activity. But a look at the detail shows that growth over the quarter was almost entirely reliant on the public sector. Private sector final demand fell 0.3 per cent, pulled down by the largest quarterly drop in household consumption since the September quarter 2021’s COVID-19 lockdown, as well as by a fall in overall private sector investment. Instead, activity was driven mainly by a further acceleration in growth in general government consumption, alongside a more modest contribution from public sector investment.
A key message from this week’s national accounts numbers is that the RBA’s monetary policy settings (13 rate hikes and 425bp of cumulative tightening to date) have exerted significant pressure on Australian households, and that this in turn has produced a painful squeeze on household consumption. Readers may recall from last week’s note that in the RBA’s August 2024 Statement on Monetary Policy (SMP) a key assumption underpinning the central bank’s forecasts was that household consumption was at or near a turning point, and expected to increase going forwards. It also followed that a key risk to those same forecasts was that the current period of subdued consumption growth proved to be more persistent than expected. In this context, the GDP numbers confirmed not only that household consumption was weak in the second quarter of this year but that in fact it was markedly weaker than the RBA’s forecasts had assumed (actual growth over the year in Q2:2024 was just 0.5 per cent vs a forecast for 1.1 per cent growth, although note also that the one per cent rise in real GDP over the year was largely in line with the RBA’s forecast for a 0.9 per cent increase). Looking ahead, the SMP reckons that the Stage 3 tax cuts, cost-of-living relief and lower inflation will all work to boost household disposable income over the second half of this year and that this in turn should prompt a recovery in consumer spending. That may well prove to be the case. But the Q2:2024 national accounts serve as a reminder of the significant downside threats to this forecast.
Meanwhile, as the RBA juggles competing risks to activity and inflation, the economy is suffering. Real GDP growth of just 1.5 per cent across 2023-24 represents the weakest annual result since 1991-92, aside from the pandemic-driven slump of 2019-20. That in turn means financial markets will continue to question the RBA’s determination to hold the line on the cash rate until next year.
Finally, before we dig into the GDP numbers in a bit more detail below and review the rest of this week’s big batch of data releases, two quick reminders.
The Dismal Science podcast is back. This week, as well as talking GDP, we look back to August’s financial market turbulence and discuss implications of the turn in the global interest rate cycle for Australia.
Q2:2024 GDP: Soft headline growth
Australia’s real GDP grew by just 0.2 per cent over the quarter (seasonally adjusted) in the June quarter 2024, to stand one per cent higher over the year. That marked the 11th consecutive quarter of economic growth and was in line with the consensus forecast, which had expected growth to run at 0.2 per cent in quarterly terms and at 0.9 per cent on an annual basis.
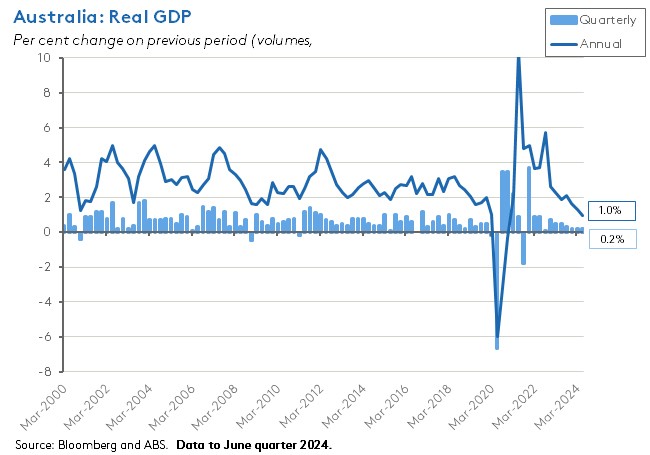
The ABS said that for the financial year 2023-24, real GDP growth was 1.5 per cent, down from 3.1 per cent in 2022-23. Excluding the pandemic-driven 0.3 per cent contraction in real output in 2019-20, this was the weakest rate of growth recorded since 1991-1992.
On a per capita basis, real GDP declined for a sixth consecutive time, falling 0.4 per cent quarter-on-quarter and dropping 1.5 per cent year-on-year.
Labour productivity as measured by GDP per hour worked fell 0.8 per cent over the quarter but was up 0.5 per cent relative to the same quarter last year. Real unit labour costs were up 1.3 per cent over the quarter and 2 per cent over the year.
Growth driven by government spending as private demand falls
Viewed through the expenditure side of the national accounts, private sector demand was the key source of weakness in the June quarter this year, falling 0.3 per cent in quarterly terms and subtracting 0.2 percentage points from quarterly real GDP growth. (Although it did grow by a subdued 0.7 per cent in annual terms.)
By expenditure component, household consumption fell 0.2 per cent over the quarter, subtracting 0.1 percentage points from quarterly growth. According to the Bureau, that quarterly fall in household spending was the weakest result since the Delta-variant lockdown squeezed consumption in Q3:2021. Household spending on goods fell by 0.1 per cent while spending on services was down 0.2 per cent. Discretionary spending overall fell 1.1 per cent over the quarter, while household spending on essentials grew by just 0.5 per cent, with the latter pushed up by spending on rents and other dwelling services and by increased demand for heating. The ABS also highlighted a fall in spending on food as households substituted more affordable options.
Similarly, private gross fixed capital formation fell 0.6 per cent quarter-on-quarter, subtracting a further 0.1 percentage points from real GDP growth. Within that total, total private business investment fell 1.5 per cent (with mining investment down 1.8 per cent and non-mining investment dropping by 1.4 per cent). The ABS said business investment in machinery and equipment was down 2.4 per cent, reflecting falls in capital expenditure in the agriculture and retail sectors. That decline in business investment more than offset a small 0.1 per cent increase in dwelling investment and a 3.9 per cent rise in ownership transfer costs.
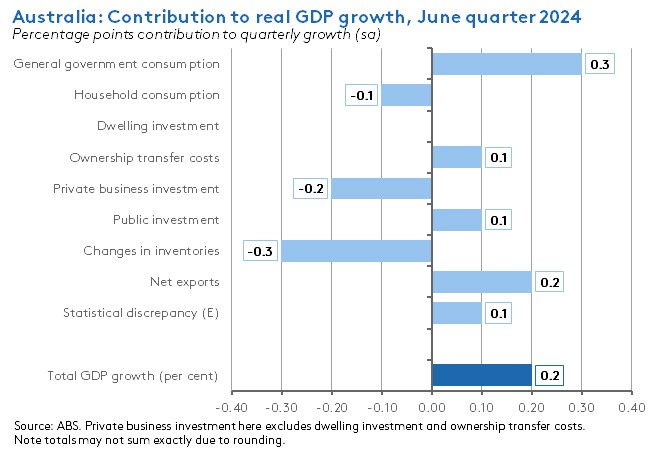
In contrast, public sector demand grew by a strong 1.4 per cent over the quarter and contributed 0.4 percentage points to total real GDP growth. Public demand was up 3.7 per cent over the year.
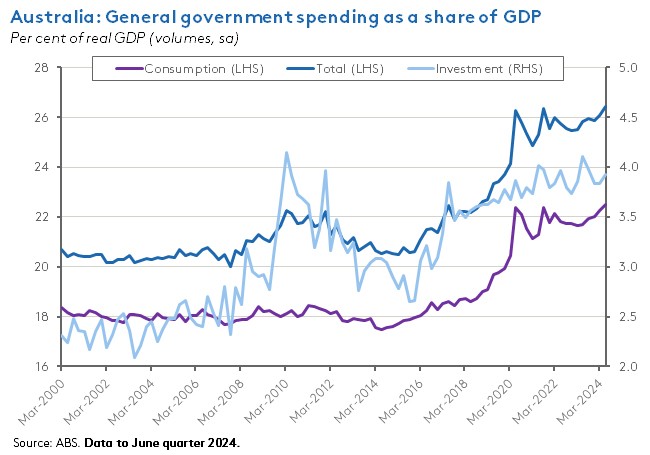
General government consumption was up 1.4 per cent quarter-on-quarter, adding 0.3 percentage points to overall growth while public sector gross fixed capital formation rose 1.5 per cent, contributing a further 0.1 percentage point. The ABS said growth in government consumption reflected ongoing strength in social benefits to households, including strength in spending on national programs providing health services. At the same time, state and local government expenditure was also up. As a result, the share of government expenditure in the Australian economy remains notably elevated.
Changes in inventories subtracted a further 0.3 percentage points from quarterly GDP growth, due to a smaller increase compared to the March quarter. That was only partially offset by a positive 0.2 percentage point contribution from net exports, reflecting a rise in exports and a fall in imports.
Household savings rates remain low
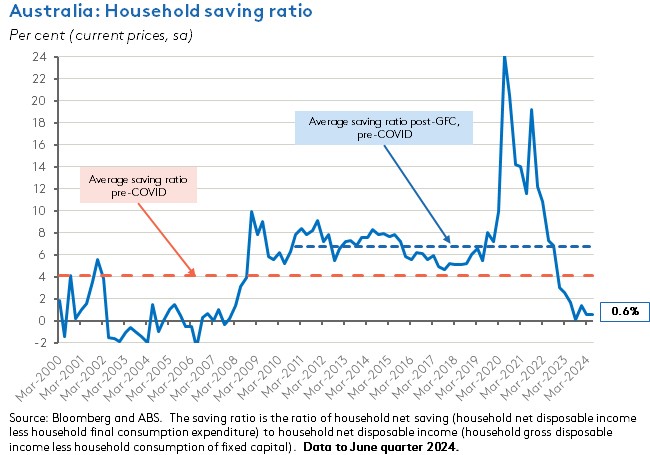
The income measure of the national accounts showed the household saving ratio remaining at a low 0.6 per cent, with growth in gross disposable income up 0.9 per cent over the quarter as a $7.8 billion increase in gross income outpaced a $4 billion rise in income payable. Nominal household spending was up 0.7 per cent. Over the whole of 2023-24, the annual savings rate was 0.9 per cent – the lowest since 2006-07.
Elsewhere on the income side of the national accounts, profits (gross operating surplus) were down 0.6 per cent over the quarter. Profits of private non-financial corporations were down 2.8 per cent in quarterly terms, led by a 7.8 per cent drop in mining as weaker global demand led to a decline in resource prices.
The compensation of employees was up 0.9 per cent over the quarter and 6.3 per cent over the year, rising 7.5 per cent in 2023-24. The latter result was down from a 10.1 per cent rise in 2022-23, which tells a story consistent with a degree of easing in what nevertheless remains a tight labour market.
Growth in GVA soft in last quarter
The ABS said growth in Gross value added (GVA) was 0.3 per cent in quarterly terms and 0.9 per cent in annual terms over the June quarter, with quarterly increases in activity across 13 of the 19 industries.
Service industries were the main growth drivers across the quarter. In terms of market services, growth was led by Information, media and telecommunications (up 1.6 per cent), Postal and warehousing (up 0.6 per cent) and Professional, scientific, and technical services (up 0.4 per cent). At the same time, non-market services enjoyed a 7th consecutive quarterly increase, with rises for Public administration and safety and for Education and training (both up 0.6 per cent) and for Health care and social assistance (up 0.4 per cent).
GVA in mining fell 0.3 per cent due to the consequences of adverse weather for coal and LNG production. There was also a large drop for Arts and recreation services (down 0.8 per cent) which the ABS attributed in part to payback after large music and sporting events boosted activity in the March quarter. A similar effect also applied to Accommodation and food services (down 0.3 per cent).
Nominal growth subdued although domestic price pressures persist
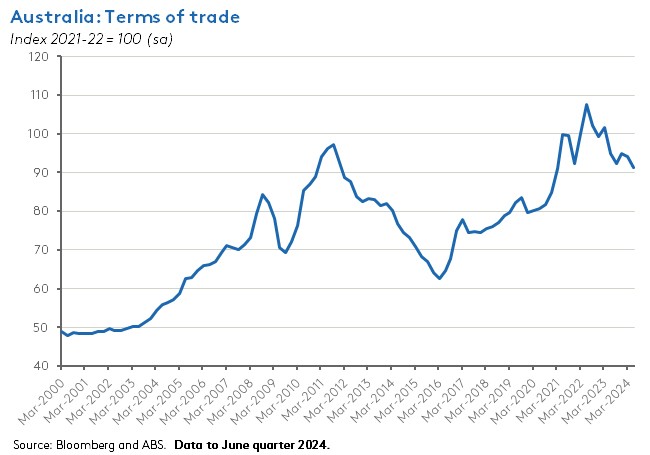
Nominal GDP also rose by just 0.2 per cent quarter-on-quarter (but was up 4.4 per cent year-on-year) as the implicit price deflator was flat over the quarter. The latter occurred because increases in domestic prices were offset by a three per cent decline in the terms of trade.
The domestic final demand implicit price deflator rose 0.9 per cent over the June quarter to be up 4.2 per cent over the year. Domestic demand prices were up 4.6 per cent over 2023-24, with the ABS highlighting the roles of high construction prices and skilled labour shortages in driving cost pressures. Still, price growth is down markedly from its 2022-23 peak of 6.6 per cent.
The fall in the terms of trade reflected a second consecutive quarterly decline in commodity prices as the softer global demand for iron ore and coal noted above delivered a drop in resource prices. Import prices were unchanged on a quarterly basis, as higher freight prices were offset by lower oil prices. As the chart below shows, despite their recent decline, Australia’s terms of trade remain relatively high by historical standards.
What else happened on the Australian data front this week?
The ABS Monthly Household Spending Indicator rose 0.8 per cent over the month in July 2024 (seasonally adjusted) to be up 2.9 per cent compared to July 2023. That followed a 0.5 per cent fall in June and a 0.7 per cent rise in May, with the Bureau noting that in trend terms spending has now been flat for the past three months. Spending on essentials continues to outpace discretionary spending.
Australia’s current account deficit widened by $4.4 billion in the June quarter of this year, increasing from $6.3 billion in Q1:2024 to $10.7 billion in Q2:2024 (seasonally adjusted). According to the ABS, the surplus on the balance on goods and services narrowed from $15.9 billion to $12 billion while the net primary income deficit widened from $21.9 billion to $22.5 billion. The narrowing in the former was driven by lower values for exports of iron ore and coal. The June quarter’s current account deficit was the largest since the June quarter 2018 and was also the first back-to-back deficit since the March quarter 2019.
The July 2024 balance on goods trade increased by $0.6 billion to a surplus of $6 billion (seasonally adjusted). The ABS said goods exports were up $0.3 billion (0.7 per cent) over the month while imports fell $0.3 billion (0.8 per cent)
The ABS published Government Finance Statistics for the June quarter 2024. The numbers report that the general government net operating balance rose from a surplus of $4.5 billion in the March quarter to $15 billion last quarter. General government tax revenue was up 17.5 per cent from $193 billion to $226.8 billion, while total general government revenue rose 14.3 per cent from $236.7 billion to $270.5 billion. Over the same period, total general government expenses rose ten per cent from $232.2 billion to $255.5 billion. See also ABS Insights in Government Finance Statistics June 2024 which provides analysis on a financial year basis.
The ANZ-Indeed Job Ads Index fell 2.1 per cent over the month in August 2024, following an (upwardly revised) 2.7 per cent monthly decline in July. Job Ads have now fallen for seven consecutive months. They are down 15.3 per cent over the year to date, down 22.9 per cent from the same month last year and are 29.8 per cent lower than their November 2022 peak. Even so, the series is still 11.4 per cent above pre-pandemic levels.
The ANZ-Roy Morgan Consumer Confidence Index rose a modest 0.5 points to 83.1 index points in the week ending 1 September 2024, keeping the index within the same tight range that has applied over the past month. The various subindices were mixed over the week, with modest gains for ‘future financial conditions’ and ‘short-term economic confidence’ mostly offset by falls for the ‘current financial conditions’, ‘medium-term economic confidence’ and ‘time to buy a major household item’ subindices. Households’ confidence about future financial conditions is now at a five-month high and this is the only subindex to be above 100 points and in ‘positive’ territory. Meanwhile, the survey measure of Weekly inflation expectations fell 0.2 percentage points to 4.6 per cent- the lowest reading since November 2021.
The CoreLogic National Home Value Index (HVI) rose 0.5 per cent over the month of August 2024, leaving home values up 7.1 per cent over the year. CoreLogic noted that despite the monthly gain exceeding July’s (downwardly revised) 0.3 per cent increase, the pace of house price growth has slowed significantly over time: the latest 1.3 per cent quarterly increase in national home values is less than half the 2.7 per cent rate recorded in the same quarterly period last year. While demand for housing continues to exceed supply, the data provider reckons that the flow of advertised demand and supply are becoming increasingly balanced, albeit with significant regional variation. One notable result reported this month was that the median dwelling value in Melbourne ($776,044) has been overtaken by median values in Perth ($785,250) for the first time since February 2015 and in Adelaide ($790,800) for the first time in the forty-year history of the series. Values in Melbourne have been influenced by increased supply, weaker interstate migration across Victoria, and increased taxes on investment property owners. Meanwhile, the national CoreLogic hedonic rent index was unchanged for a second consecutive month in August, while the annual rate of growth slowed to 7.2 per cent – the lowest pace of increase since May 2021. This correlates with a drop in net overseas migration, with inflows having fallen from 165,000 in the March quarter of last year to 107,000 in the December quarter.
The ABS said the total Building Approvals in July 2024 were up 10.4 per cent over the month (seasonally adjusted) and 14.3 per cent higher over the year, at 14,797. Approvals for private sector houses were up 0.6 per cent month-on-month and 13.1 per cent year-on-year, at 9,252. Approvals for private sector dwellings excluding houses jumped 32.1 per cent over the month and were up 15.9 per cent over the year, at 5,234. The rise represented an increase in approvals for high-density apartments, with 2,504 apartments approved in nine or more storey blocks in July, compared to just 533 in June (original basis). Despite the lift in total approvals in July, the Bureau noted they were still 5.1 per cent below their five-year average. The value of total buildings approved was up 6.8 per cent over the month to $13.2 billion.
The Bureau also published Business Indicators for the June quarter 2024, which reported that company gross operating profits were down 5.3 per cent in quarterly terms while wages and salaries were up 0.7 per cent.
Last Friday, the ABS said retail turnover was flat over the monthly of July 2024 (seasonally adjusted basis) but up 2.3 per cent over the year. The Bureau noted that turnover had growth by 0.5 per cent in May and June this year, boosted by mid-year sales activity, so the July result maintained the higher level of sales.
Other things to note . . .
- RBA Governor Michele Bullock gave a speech on The costs of high inflation. As well as relitigating the case for disinflation by emphasising the pain and risks associated with above-target inflation, the Governor previewed the forthcoming September 2024 Financial Stability Review (FSR) and its assessment of the health of household finances. According to the FSR, despite the pressure on households noted in the GDP discussion above, only a fairly small share of borrowers is currently at risk of falling behind on mortgage repayments. In the case of owner-occupiers with variable rate loans, the RBA reckons that around five per cent have a cash flow shortage, whereby the combined total of essential spending and scheduled mortgage repayments is greater than income.
- Transcript of RBA Deputy Governor Andrew Hauser’s interview with the Conversation podcast which includes a discussion on why the RBA might differ from the US Fed in terms of the future trajectory of the policy rate.
- Suggestions from an ex-RBA employee about making the RBA more accountable.
- The ABS presents nine insights on the Australian economy in the June quarter 2024.
- How Australian economists would fix the housing problem: Ease planning restrictions and provide more public housing.
- From the AFR, will Albanese lead Australia’s last majority government?
- Treasury Secretary Stephen Kennedy gave a speech on Evidence-informed policy making, which he defined as ‘a deliberate and rigorous approach that seeks to support policy with the best available evidence, rather than intuition, ideology, anecdote, or short-term political expediency.’
- ABC Business on the lithium price crash.
- A look at political donations and tax deductions in Australia and New Zealand.
- The Lowy Institute examines the Great Game in the Pacific Islands.
- As the chances of central banks pulling off a soft landing for the world economy appear to have increased, the Economist magazine asks, what went right with global monetary policy?
- Related, the FT’s Martin Wolf considers lessons from the Great Inflation.
- Also from the FT, lunch with Eugene ‘efficient markets’ Fama.
- On the macroeconomics of narratives.
- Instead of a new Cold War, is the world heading for a 1930s-style collapse in the global order?
- The September 2024 edition of the IMF’s Finance & Development magazine is out. The theme for this issue is productivity and prosperity.
- Also from the Fund, the August 2024 Selected Issues Report on China considers a range of issues including deflation vulnerability, service sector productivity, reform of China’s emissions trading system, inward and outward foreign direct investment and corporate sector vulnerabilities.
- The WSJ’s Greg Ip reckons there is a China-shaped hole in the global economy.
- An economic analysis of the US Opioid Crisis.
- Could solar power make drought optional?
- Advances in grid-scale battery storage.
- On adapting to the AI revolution.
- Grattan Podcast on how to reform NDIS housing and support.
- The Odd Lots podcast talks to Adam Posen about the outlook for US inflation.
- Conversations with Tyler hosts Philip Ball.
Latest news
Already a member?
Login to view this content


