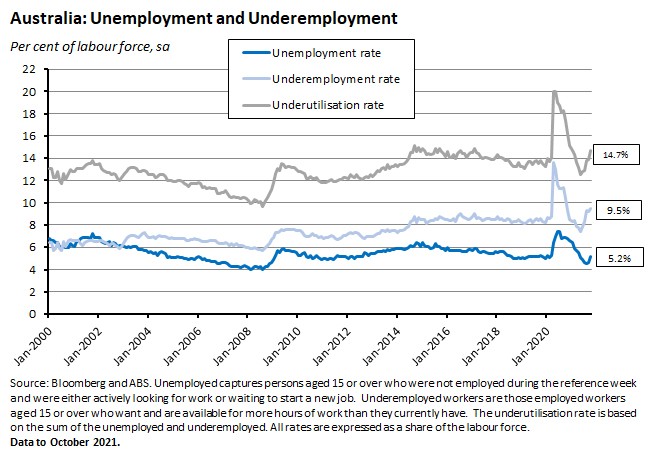
The main focus of this week’s Australian data releases was some early evidence on the post-lockdown labour market. One indicator came in the form of the October 2021 labour force results, although as the underpinning labour force survey only covered the period from 26 September to 9 October, it actually missed most of the easing in restrictions across New South Wales, Victoria and the ACT. Still, the labour force headlines were discouraging: employment dropped for a third consecutive month, the unemployment rate jumped from 4.6 per cent in September to 5.2 per cent in October and the underemployment rate rose from 9.2 per cent to 9.5 per cent.
More positively, however, the details offered some signs of labour market normalisation as the participation rate edged up for the first time since June, signalling that Australians have started to return to the labour force. This week’s payroll jobs numbers, which covered the fortnight to the week ending 16 October and therefore captured more of the New South Wales exit from lockdown, were more upbeat. Total job numbers rose on the back of substantial gains in New South Wales and the ACT along with sizeable increases in jobs in accommodation and food services and arts and recreation services. Labour market signals for the next month or two could well continue to be noisy as rising employment jousts with increasing participation rates, but high vacancy rates and elevated numbers of job ads suggest ample scope for a reasonably rapid employment recovery.
For more detail on employment and unemployment, including a look at the state-level data, see the updated labour market chart pack.
More evidence of the impact of the East Coast’s exit from lockdown came in this week’s NAB Business and Westpac-Melbourne Institute Consumer surveys. The former reported marked improvements in business conditions and business confidence in October and although the latter showed only a marginal rise in consumer sentiment in November, it did depict households feeling very upbeat about the state of the labour market.
The global economic news was dominated by two big stories this week. One of those – the scramble to deliver enhanced climate targets in the final few days of COP26 – was still underway at the time of writing. The other was a surge in US consumer price inflation. The annual rate of increase in the US CPI rose to 6.2 per cent in October, its fastest pace in more than three decades. With core inflation and several other measures of underlying inflationary pressures also flashing warning signals, the Fed’s position that US inflation should be seen as a purely ‘transitory’ phenomenon is looking increasingly precarious. At minimum, the applicable definition of transitory now seems to involve a much longer-lasting period of elevated prices rises than it appeared to imply earlier this year.
We talk US inflation and also discuss developments in the Australian labour market in this week’s Dismal Science podcast. Listen and subscribe: Apple Podcasts | Google Podcasts | Spotify
Finally, this week’s linkage roundup includes the impact of the pandemic on Australian commercial property, causes and implications of the rise in Australian household liquidity, lessons from the RBA’s messy exit from yield curve control, two assessments of government pledges and promises at COP26, China’s real estate hangover, bitcoin and systemic risk, the economics of the US opioid crisis, ten trends to watch next year and a look at the recent dramatic fluctuations in lumber prices.
What I’ve been following in Australia . . .
What happened:
The ABS said that Australia’s unemployment rate rose by 0.6 percentage points to 5.2 per cent in October 2021 (seasonally adjusted). The underemployment rate rose 0.3 percentage points to 9.5 per cent, taking the underutilisation rate up to 14.7 per cent.
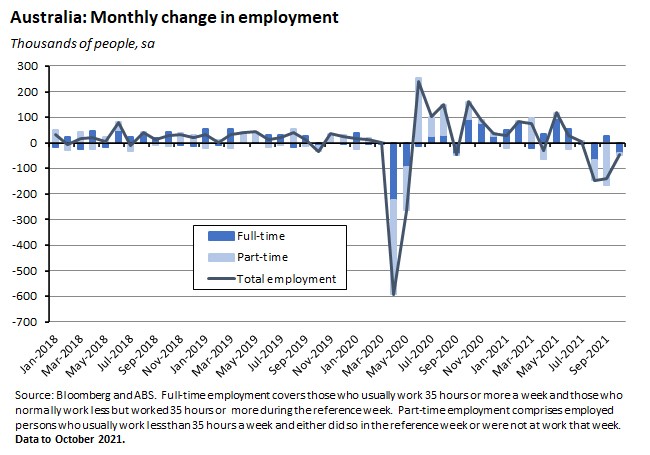
Employment fell by 46,300 people (down 0.4 per cent) last month, with full-time employment dropping by 40,400 people and part-time employment falling by 5,900. The part-time share of employment was 30.3 per cent, unchanged from September.
Monthly hours worked in all jobs fell by 1.5 million hours (down 0.1 per cent) in October. The number of Australians working zero hours due to no work, not enough work or being stood down rose to more than 189,000 in October from closer to 185,000 in September, although that aggregate increase disguised a significant drop in numbers in New South Wales.
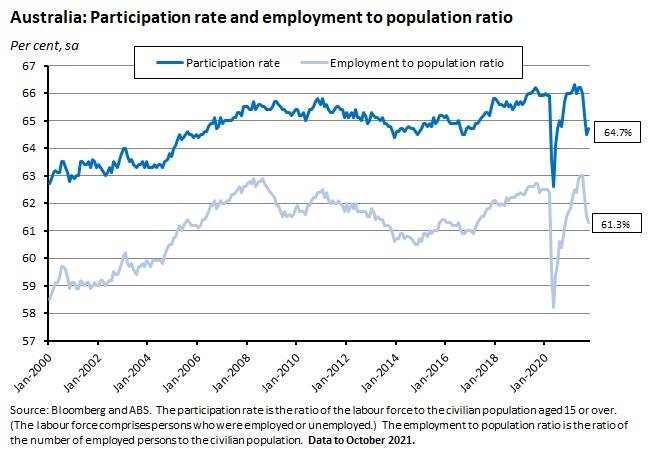
The participation rate edged higher by 0.1 percentage points to 64.7 per cent while the employment to population ratio fell by 0.3 percentage points to 61.3 per cent.
By state and territory, the unemployment rate rose markedly in New South Wales (up 0.8 percentage points), Victoria (up 0.9 percentage points) and the ACT (up 2.5 percentage points).For a detailed look at the state data and for more labour market charts in general, please see the updated labour market chart pack.
The ABS also included a special article on job attachment during the pandemic in the October labour force release. ‘Job attachment’ refers to whether someone has a job that they are connected to, and crucially, it is possible for someone to have attachment to a job without necessarily being classed as employed. Pre-pandemic, this status applied to a relatively small group of people – those with a job but on leave without pay for more than a month (e.g. unpaid parental leave) and people who had a job but hadn’t yet started or restarted work. COVID-19 changed this, however.
During the pandemic, a large number of people worked reduced or no hours due to lockdowns but were still attached to their job. The Bureau notes that in March 2020 there were 190,000 people who considered they had a job that they were attached to, but who weren’t classed as employed. By May 2020 this number had shot up to 594,000. It subsequently returned to pre-pandemic levels by the first half of this year. The onset of the Delta variant and new lockdowns then saw this number jump back up to 531,000 in September this year. The bulk of this group – around 75 per cent – was classified as not in the labour force, partly reflecting the way that lockdowns limit people’s ability to look for / be available for work, but also that some people may be less likely to look for another job if they feel that they still have one.
Prior to the pandemic, unemployed people with job attachment typically accounted for just 0.2 per cent of the population, but the ABS notes that this rose to a peak of around 0.7 per cent in May 2020 and then again to 0.7 per cent last month. Similarly, while people not in the labour force with job attachment was around 0.8 per cent of the population before the pandemic, it rose to a peak of 2.2 per cent in May 2020 and was back up at two per cent in September 2021 (easing slightly to 1.9 per cent last month).
Why it matters:
The market’s median forecast for October had been for a 50,000 increase in employment and a 4.8 per cent unemployment rate, so the actual outcomes (a 46,300 drop and a 5.2 per cent rate) were considerably weaker than expected. So, the headline news from October was clearly disappointing. Still, there are three reasons to feel a bit more upbeat about the results that go beyond those headline numbers.
First, the fall in employment last month was considerably smaller than the +140,000 declines seen in August and September.
Second, it’s worth noting the timing of the October labour force survey that underpins the data, which covered the period from 26 September to 9 October. While this did include some early changes to public health restrictions, particularly in New South Wales, it did not cover the more significant moves to ease lockdowns that got underway later in the month (on 11 October in New South Wales, 15 October in the ACT and 22 October in Victoria) and therefore it would have missed any subsequent boost to employment last month.
Third, as we’ve emphasised over the past couple of months, the information content of the unemployment rate is heavily distorted by lockdowns as they constrain the ability of workers to seek and be available for employment. Lockdowns see many workers exit the labour force altogether – reflected in a declining participation rate, a fall in the size of the labour force and a rise in the number of those classified as ‘not in the labour force’. In this context, then, it is possible to view the rise in reported unemployment last month as a sign of the labour market starting to normalise after several months of lockdowns, with the participation rate rising for the first time since June of this year. The number of unemployed rose by more than 81,000 last month while the number of employed fell by more than 46,000. As a result, the size of the labour force increased by more than 35,000 people (equivalently, the number of people not in the labour force fell by the same amount). That was the first increase in labour force numbers since June this year.
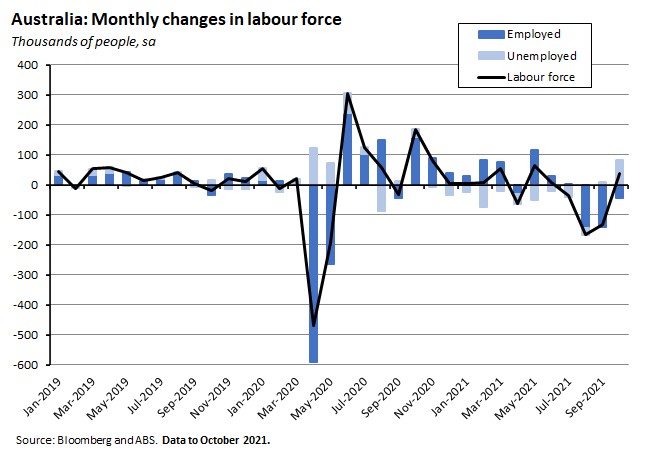
The next couple of months’ worth of labour market releases are likely to see a tug of war between two opposing forces. On the one hand, the exit from lockdowns and the re-opening of New South Wales, Victoria and the ACT should help drive up employment, with high vacancy rates and job ad numbers a positive indicator of the potential for quite rapid employment growth. This week’s payroll data showed early signs of that process already underway in New South Wales (see next story). On the other hand, a rising participation rate will also mean that the labour force will continue to expand. To the extent that the latter process runs ahead of the growth in employment, the unemployment rate could continue to increase even as labour market conditions improve, before the more usual relationship between employment, unemployment and overall labour market conditions is restored.
What happened:
According to the ABS, between the weeks ending 2 October and 16 October 2021, the number of payroll jobs rose 1.3 per cent after having fallen 0.5 per cent over the previous fortnight. Total wages paid fell 0.9 per cent after having fallen 3.6 per cent over the previous fortnight.
Job numbers were up 0.9 per cent over the past month and 0.5 per cent over the year.
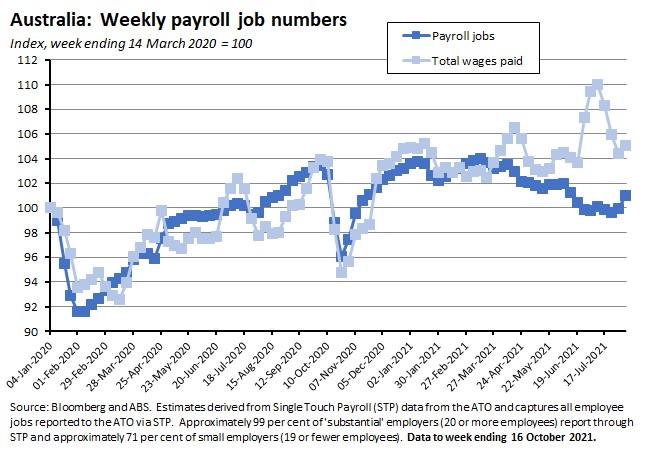
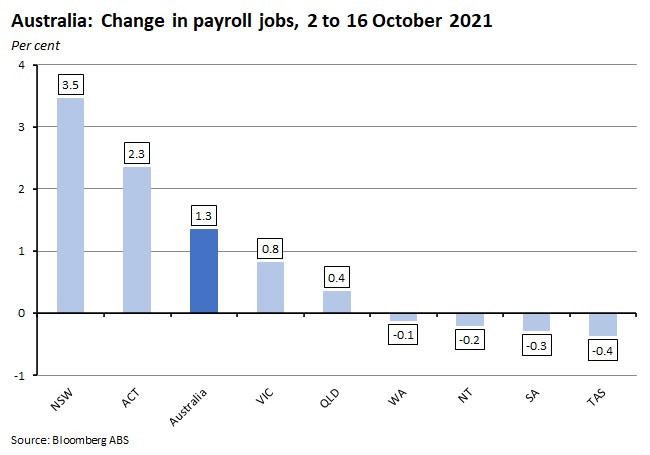
By state and territory, job numbers over the past fortnight jumped by 3.5 per cent in New South Wales and by 2.3 per cent in the ACT and were also up by 0.8 per cent in Victoria.
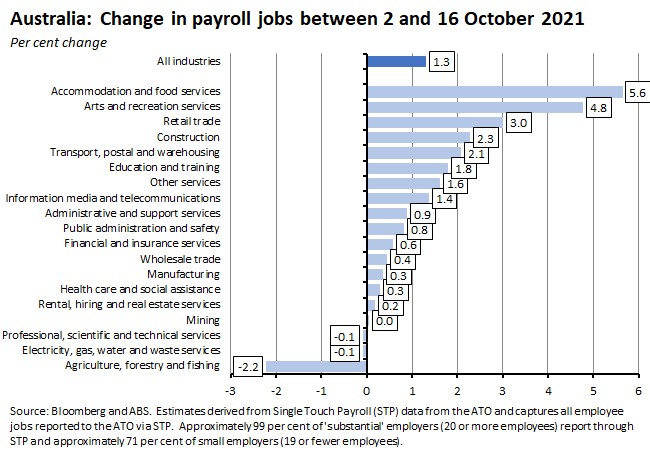
By industry, the largest changes in payroll jobs over the latest fortnight of data were in accommodation and food services (up 5.6 per cent), arts and recreation services (up 4.8 per cent) and retail trade (up three per cent).
By demographic, jobs worked by males were up 1.4 per cent over the latest two weeks of data and jobs worked by females were up 1.3 percent. By age group, the largest gain over the same period was for the 15-19 years old category, which saw a 2.9 per cent gain. The next largest increase was 1.5 per cent for those aged 20-29.
Why it matters:
The payroll job numbers show the start of a labour market recovery as the three East coast states emerged from lockdown. In particular, the ABS notes that the latest week of its payroll data, covering the week ending on 16 October coincided with restrictions starting to ease in New South Wales and the ACT. That final week of data saw payroll jobs increasing by 2.2 per cent in New South Wales and 1.6 per cent in the ACT, contributing to a national gain of about one per cent. Victoria, where the easing of lockdown restrictions came on 22 October, also saw a 0.7 per cent increase in payroll jobs over the previous week.
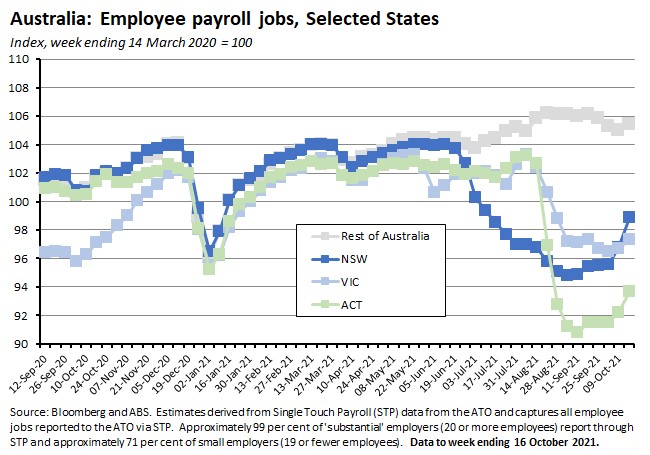
Similarly, the ABS noted that the large increases in job numbers in accommodation and food services and arts and recreation services mainly reflected recovery in these industries in New South Wales, with that state accounting for more than 95 per cent of the national increase in jobs in the former industry and more than 92 per cent of the national increase in jobs in the latter. That still implied that more than 56 per cent of NSW jobs lost in accommodation and food services and more than 53 per cent of the NSW jobs lost in arts and recreations services since late June have yet to be recovered, however.
It’s also worth remembering that current COVID-related government support payments are paid directly to people or businesses, rather than through payrolls, which is likely to have affected the comparison of payroll job falls over the pandemic. That’s because payroll jobs only include jobs where a person was paid through the payroll and therefore a fall in payroll jobs can include employees who remained attached to their job but were temporarily stood down and not paid by their employer.
What happened:
The NAB monthly business survey for October 2021 showed both business conditions and business confidence rising over the month. Business conditions rose six points to +11 index points.
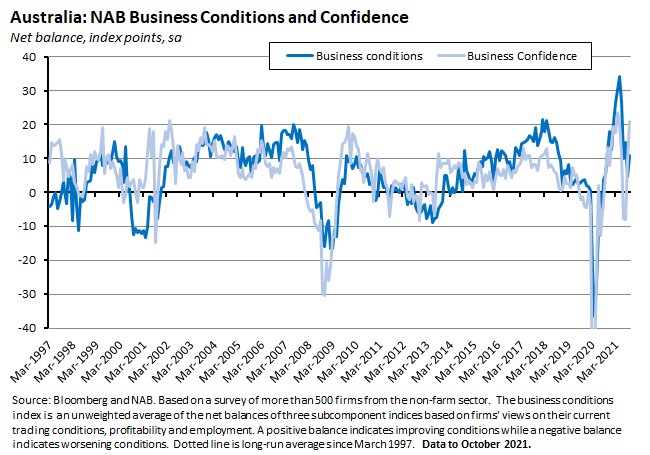
All three components of conditions increased last month, with trading conditions up seven points, profitability up six points and employment up five points. By industry, there were large increases in conditions reported for mining, construction, recreational and personal services and manufacturing, offsetting a sharp fall for transport and utilities. By state, conditions rebounded in New South Wales (up 22 points) while there were falls in Victoria, South Australia and Western Australia.
Business confidence jumped by 11 points to +21 index points in October. Confidence was up strongly in retail, finance, property and business, recreation and personal services, mining and manufacturing and is now in positive territory for all industries. By state, confidence jumped by 18 points in Victoria and there were also strong gains in Queensland and South Australia. Again, confidence is now in positive territory across all states.
The rate of capacity utilisation rose from 78.2 per cent in September to 81.5 per cent in October, while forward orders rose by 16 points to a reading of +15 index points.
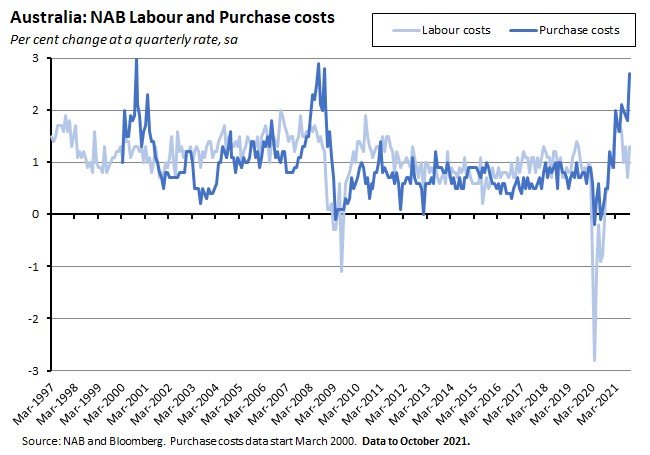
Inflation indicators continue to point to significant price pressures: growth in purchase costs reached 2.7 per cent in quarterly terms in October, the fastest rate since 2008. Labour costs increased by 1.3 per cent and final product prices at 1.1 per cent.
Why it matters:
The end of lockdowns in New South Wales, Victoria and the ACT triggered sharp increases both in business conditions and in business confidence last month, consistent with a strong rebound in activity. And an increase in capacity utilisation and a steep increase in forward orders indicates that the upturn is expected to endure.
The NAB monthly survey also reported continued inflationary pressures, with particularly strong growth in purchase costs suggesting an ongoing impact from supply chain disruptions. NAB also reported that the share of firms reporting availability of materials as a major constraint has risen dramatically over the year, climbing to more than 20 percentage points above average and a new series record. The share of firms reporting difficulty in finding suitable labour as a key constraint is also high – similar to the levels reached during the mining boom period, according to NAB. The latest survey results suggest that while labour cost pressures are concentrated in the wholesale, manufacturing and construction sectors, purchase cost pressures are more widespread.
What happened:
The Westpac-Melbourne Institute Index of Consumer Sentiment (pdf) rose 0.6 per cent to an index reading of 105.3 in November. Two of the five subindices fell over the month: family finances vs a year ago (down 4.5 per cent) and family finances next 12 months (down 0.7 per cent). The other three subindices reported increases: Economics conditions next 12 months (up 3.3 per cent), economic conditions next five years (up 2.6 per cent) and time to buy a major household item (up 1.8 per cent).
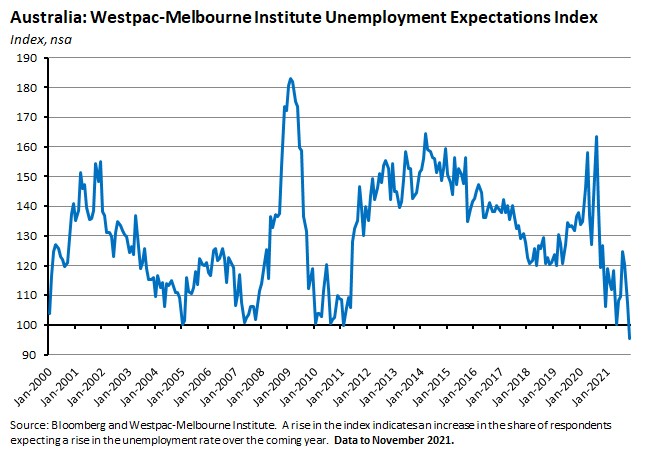
The Unemployment Expectations Index fell 11.1 per cent over the month to an index reading of 95.3, indicating a sharp fall in the share of respondents expecting unemployment to increase over the coming year.
The time to buy a dwelling index rose 9.4 per cent over the month while the house price expectations index fell 2.4 per cent.
Why it matters:
Consumer sentiment was little changed in November relative to last month and confidence has now been fairly stable for the past couple of months. That said, New South Wales did see an increase of 4.4 per cent in response to the state’s exit from lockdown in October.
Much more dramatic than the small move in the headline sentiment index was the sharp decline in the Unemployment Expectations Index, which is now at its lowest level since the mid-1990s and is signalling a very high level of household confidence in the labour market.
What happened:
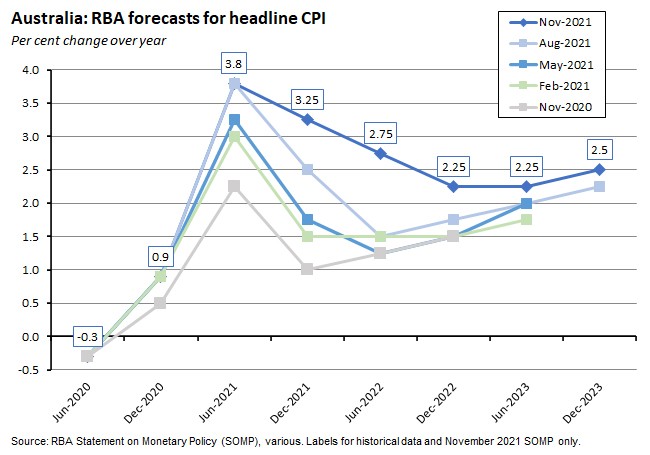
Last Friday, the RBA published the November 2021 Statement on Monetary Policy (SOMP). The new SOMP sets out in more detail the RBA’s latest forecasts for the Australian economy. The starting point for the central bank’s projections is that while the setback from the Delta outbreak was significant (the RBA thinks that GDP shrank by about 2.5 per cent in the September quarter of this year), the economy is now recovering rapidly. As a result, under the RBA’s baseline forecast, growth is expected to end this year at around three per cent (down from four per cent in the August SOMP) but then finish 2022 at 5.5 per cent before returning to a more trend-like 2.5 per cent over 2023.

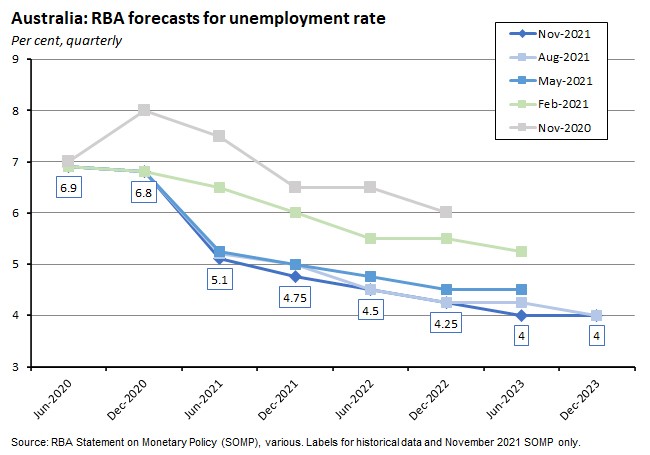
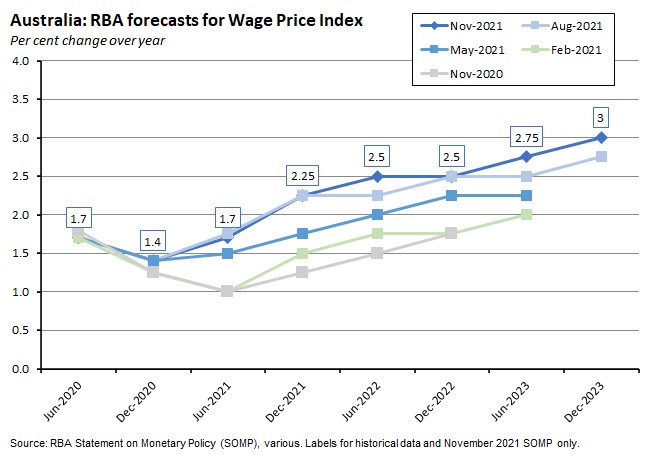
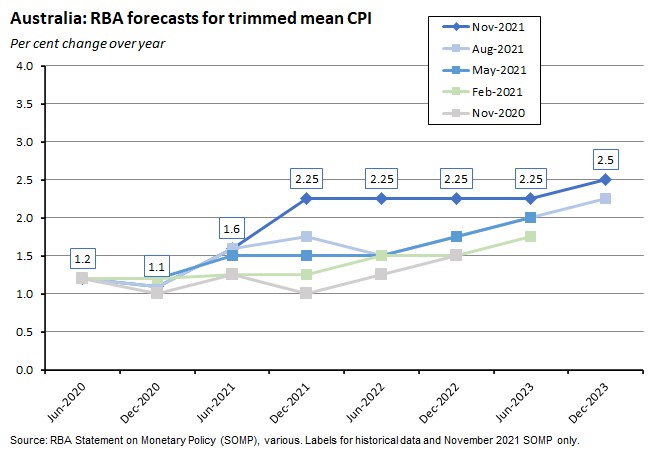
That pickup in economic growth is also predicted to see the unemployment rate finish this year at a little below five per cent before declining slowly but steadily to four per cent by the end of 2023. However, the RBA reckons that the relatively low pre-pandemic starting point for both wages growth and inflation in Australia, plus the presence of spare capacity in the labour market and inertia in the wage-setting process, means that wage growth will increase only gradually, rising to around three per cent by the end of 2023. And underlying inflation is only forecast to rise to 2.25 per cent by the end of next year and to around 2.5 per cent by the end of 2023.
In terms of the implications for monetary policy of this scenario, the SOMP states:
‘If the economy evolves in line with the central scenario, wages growth is expected to have edged up to around three per cent and underlying inflation would have only just reached the middle of the two to three per cent target band by the end of 2023, for the first time in seven years. Depending on the trajectory of the economy at that time, the Board judges that this outcome could be consistent with the first increase in the cash rate being in 2024. In some other plausible scenarios, wages growth and inflation could be higher than implied by the central scenario. If this were to eventuate, an increase in the cash rate in 2023 could be warranted. However, in the Board's view, the latest data and forecasts do not warrant an increase in the cash rate in 2022.’
As has become traditional during the pandemic, the SOMP also presents upside and downside scenarios for the economy. In the upside scenario, stronger-than-expected wealth effects and reduced uncertainty associated with the pandemic translate into stronger consumption growth which encourages stronger business investment, faster growth in employment, stronger wage growth and higher inflation, with inflation rising to be above three per cent by the end of 2023. Under the downside scenario, adverse health outcomes such as the emergence of a new variant or a declining efficacy of vaccines lead to a temporary resumption of lockdowns and restrictions on activity that see a slowdown in consumption and a delayed opening of international borders. That also leads to softer consumer and business confidence, more subdued growth, a weaker labour market, and underlying inflation stuck below two per cent for most of the forecast.
Why it matters:
The upgrades to the RBA’s forecasts for inflation and wage growth were trailed earlier last week following the 2 November monetary policy meeting and Governor Lowe’s webinar on the same afternoon, so the main impact of the SOMP is to add more detail to the outline we received back then.
The main point of interest continues to be the divergence between the RBA’s views on wage growth, inflation and (therefore) the likely path for the cash rate, and the much more hawkish views held by financial markets. Here, the new projections do show the RBA has now baked in a higher headline rate of inflation than was the case at the time of the August SOMP.
It is also somewhat more upbeat on the labour market, although the change is not dramatic: the unemployment is forecast to fall to four per cent by the June quarter of 2023 instead of the December quarter:
And the implication for wage growth (as captured by the WPI) is a somewhat higher profile than had been expected in the August SOMP.
But a look at the forecast revisions for the trimmed mean shows that while underlying inflation is also now expected to be on a higher trajectory, it’s only projected to hit 2.5 per cent by the end of the forecast period. Hence the SOMP’s comment that its baseline scenario ‘could be consistent with the first increase in the cash rate being in 2024.’
Unless persuaded otherwise by the near-term data flow, however, markets are likely to continue to view these forecasts as too cautious and to see the risks to wage growth and inflation as skewed to the upside. This week’s strong US inflation reading (see below) will reinforce that sentiment.
. . . and what I’ve been following in the global economy
What happened:
According to the Bureau of Labour Statistics (BLS), the US Consumer Price Index (CPI) rose 0.9 per cent over the month in October (seasonally adjusted). The annual rate of CPI inflation was 6.2 per cent.
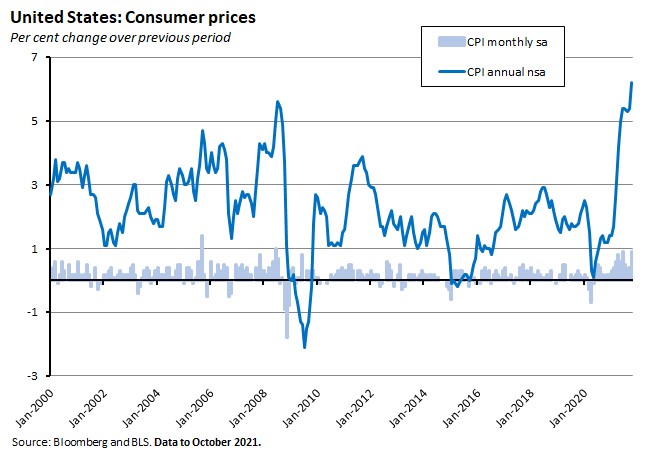
The BLS cited a ‘broad-based’ rise in prices, with the larger contributors including rises for energy (up 4.8 per cent over the month with gasoline up 6.1 per cent, natural gas up 6.6 per cent and fuel oil up 12.3 per cent), food (up 0.9 per cent), used cars and trucks (up 2.5 per cent), and new vehicles (up 1.4 per cent).
The core CPI – the CPI excluding food and energy – rose 0.6 per cent over the month and was up 4.6 per cent in annual terms.
Why it matters:
The 6.2 per cent annual rate of CPI increase in October was the fastest rise since November 1990 and outpaced the median expectation of a 5.9 per cent print. Annual core inflation also surprised to the upside at 4.6 per cent instead of 4.3 per cent, returning its highest reading since 1991. And the monthly pace of price rises for both headline and core inflation measures in October were the strongest seen since June this year.
It’s true that a significant part of the inflation story continues to be driven by a combination of soaring energy costs and COVID-driven disruption to supply chains and labour markets. But to the extent that rising prices are driven by disruptions, those disruptions are proving to be considerably longer lasting that was expected to be the case earlier this year. Headline annual inflation has now been at five per cent or above for five consecutive months while core inflation has been at four per cent or higher for the past four months, for example.
It’s also the case that the BLS emphasised that this was a broad-based increase in inflation, with prices rising across food, medical care, vehicles, rents and furniture. Core inflation is now running at its fastest annual rate since the early 1990s and other measures of underlying inflation such as the Cleveland Fed’s trimmed mean (up 0.7 per cent month-on-month and 4.1 per cent year-on-year) and the New York Fed’s underlying inflation gauge (up 0.3 per cent month-on-month and 4.3 per cent year-on-year) are all elevated, too.
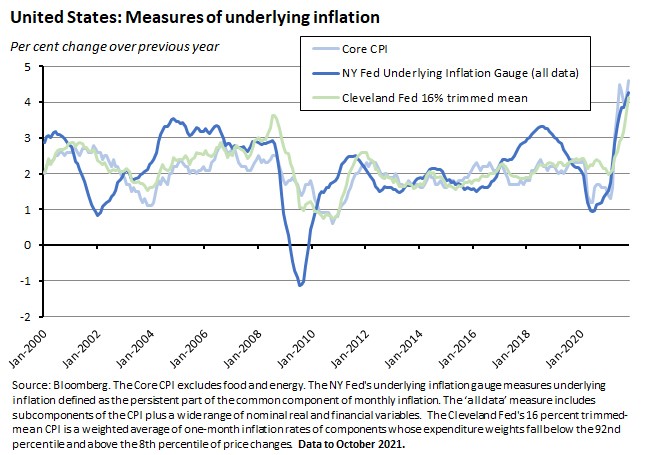
Higher actual inflation outcomes are also feeding into higher inflationary expectations. The NY Fed’s latest survey of consumers finds that median inflation expectations in October at the one-year horizon had risen to 5.7 per cent, a series record, although median expectations at the three-year horizon remained unchanged at 4.2 per cent. The University of Michigan’s Consumer Survey (pdf) reported that expectations for inflation next year rose to 4.8 per cent in October from 4.6 per cent in September, although expectations for inflation in the next five years eased slightly to 2.9 per cent.
This result will further increase markets scepticism towards the US Federal Reserve and its current (relatively) relaxed take on inflation. It will also ramp up the political pressure on the Biden administration as it seeks to pass its US$1.75 trillion Build Back Better package hot on the heels of the recently approved US$1.2 trillion Infrastructure Investment and Jobs Act, even though the administration is trying to make the case that by boosting the supply side of the economy, these measures could eventually help ease some inflationary blockages in the economy.
What happened:
Last week, the J P Morgan Global Composite PMI (pdf) rose to an index reading of 54.5 in October from 53.3 in September.
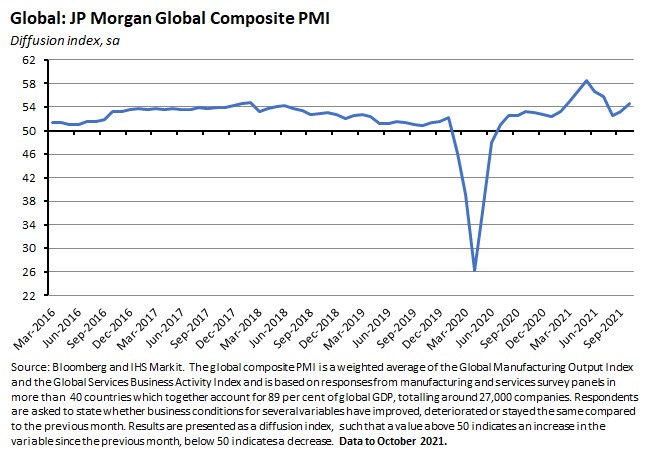
Services activity accelerated in October, with growth up across business, consumer and financial services. Manufacturing activity also continued to expand, although the pace of activity fell relative to September.
Shortages of raw materials, longer vendor lead times and some staff shortages all contributed to further substantial increases in average costs during October, with input prices rising at their fastest rate since July 2008 and record or near-record cost inflation across all six survey subsectors. The results also saw the highest increase in output prices charged since the start of that series (in October 2009).
Why it matters:
According to the Composite PMI, the rate of global economic expansion rose to a three-month high last month, propelled by stronger services sector growth. The index has now been in expansionary territory for 16 consecutive months, indicating a sustained period of global growth. At the same time, price pressures remain elevated, with record or near-record rises in input and output costs and charges.
This week’s linkage . . .
- There’s an interesting Box in the RBA’s November Statement on Monetary Policy looking at the impact of COVID-19 on Australia’s commercial property sector. The pandemic has led to large changes in where people work, leading to lower demand for office space, and has accelerated the shift to online retail, which has increased the tensions facing the bricks-and-mortar retail sector but at the same led to a significant increase in demand for industrial property including logistics and warehouse space.
- A new RBA research discussion paper on the rise in household liquidity. The paper starts from the proposition that while the expansion of household balance sheets – both assets and liabilities – is well-known, less attention has been paid to the rise in household liquid assets (cash, deposits and equities) relative to income over the same period. The authors say this growth in liquidity is closely related to developments in the housing market: higher deposits have encouraged potential homebuyers to save more in liquid assets while higher mortgage debt has increased precautionary saving, partly through paying down debt ahead of schedule. For policymakers, this rise in liquidity implies that households may be less sensitive to temporary income and wealth shocks than in the past, and the repayment risk associated with mortgage debt may have declined.
- Adam Triggs is sceptical about the case for hiking the GST. Better to focus on abolishing stamp duty, he reckons.
- Related, Grattan’s Danielle Wood argues that the federal government should give the NSW government financial support to fund the transition away from stamp duty and extend the same offer to any other state willing to take the plunge.
- New survey data from the ABS on education and work in Australia. In May 2021, 16 per cent of Australians aged 15-74 years were studying (15 per cent of men and 17 per cent of women). Between May 2020 and May 2021, an additional 1.2 per cent of Australians aged 15-74 attained non-school qualifications at bachelor degree level or above, bringing the national total to 31 per cent. Aside from those aged 65 to 74 years, more women than men had a bachelor degree or above in all age groups. Just under 13 per cent of women aged 15-74 had postgraduate qualifications, compared with 11 per cent of men.
- Also from the ABS, data on public sector earnings and employment. There were 2.1 million public sector employees at the end of June 2021, comprising more than 1.6 million in state government, more than 247,000 in Commonwealth government, and almost 191,000 in local government.
- Wilkins, Herault and Jenkins worry that Australia’s relative lack of mobility among its top one per cent of income earners may be a sign of declining economic dynamism with fewer entrepreneurs breaking into the income elite.
- The FT examines the lessons from the RBA’s ‘disorderly’ exit from yield curve control.
- The IEA reckons that India’s pledge at COP26 to target zero emissions by 2070, plus other commitments made at the Glasgow summit, would be enough to hold the rise in global temperatures to 1.8 degrees Celsius – provided that they were all implemented in full and on time. This, the IEA says, marks the first time that governments have produced targets of sufficient ambition to hold global warming below two degrees Celsius.
- According to the new State of Climate Action 2021 report from Climate Action Tracker (CAT) and the World Resources Institute (WRI), none of the 40 key indicators the report highlights are on track to reach the Paris Agreement target of limiting global warming to 1.5 degrees Celsius. Other work from CAT says that there is a massive credibility, action and commitment gap when it comes to countries’ longer-term net zero targets, while their current 2030 targets (here excluding any long-term pledges) leave the planet on track for a 2.4 degrees Celsius temperature increase by the end of the century.
- A WSJ piece warning that China’s real estate hangover could last for years. One consequence could be national annual growth rates closer to three to five per cent instead of five to six per cent, which could test the authorities’ appetite for persisting with the current policy approach.
- Related, Bloomberg Economics says that China now looks a lot like Japan did in the 1980s.
- Also from the WSJ, Greg Ip says that Biden’s economic agenda wasn’t designed for inflation.
- Slate on why the semiconductor shortage hasn’t been fixed yet. Demand has stayed high (buoyed in part by the switch to WFH), it takes time to get new factories on stream, and the sector has its own staff, equipment and raw material shortages to deal with.
- Institutional Investor on bitcoin and systemic risk. Should investors worry about a ‘cryptocalypse’, and what would that mean for the financial system more broadly?
- From the latest issue of the Journal of Economic Perspectives, When innovation goes wrong: Technological Regress and the Opioid Epidemic.
- The IMF on the COVID surge in wealth and its uneven distribution.
- The Economist lists ten trends to watch in the coming year: democracy vs autocracy; pandemic to endemic; inflation worries; the future of work; the new techlash; crypto grows up; climate crunch; travel trouble; space races; and political football.
- The Odd Lots podcast looks at how the dramatic increase in US lumber prices earlier this year was followed by an equally dramatic fall in an interesting case study of the price volatility that is now a dominant feature of some markets.
Latest news
Already a member?
Login to view this content


